
2024 Landscapes3 Metrics

Posted June 6, 2025
Landscapes3 was adopted as the comprehensive plan for Chester County in November 2018. Since then, the Planning Commission has been tracking 18 metrics to assess implementation of the six goals found within Landscapes3. The following summarizes the changes for each of these metrics based on data from 2018 through to 2024 inclusive. 2024 is the most recent year for which data is available.
Some notable findings for the metrics relating to calandar year 2024 are:
- The COVID pandemic and the shift to remote work is still impacting the county. Bus and commuter rail ridership dropped in 2020 and 2021, and they have yet to fully recover. Attendance at parks and historic sites, as well as the number of unemployed people receiving job training has partially recovered. Commuter travel times are still shorter than pre-pandemic, likely due to remote working and fewer commuters on the road.
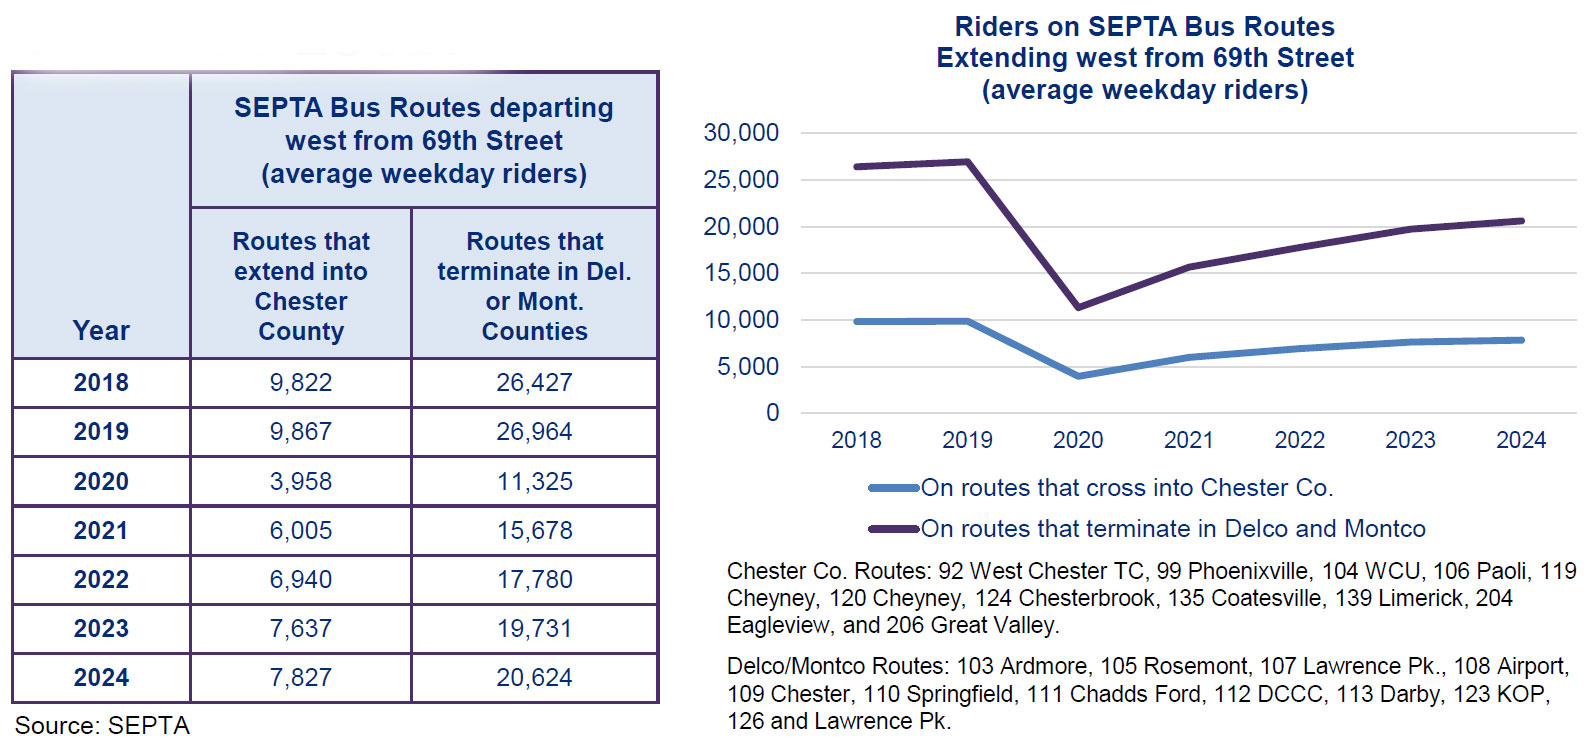
- The level of riders using public transportation has shifted in recent years, and may well continue to do so. AMTRAK ridership for Chester County dropped during the pandemic, but has nearly recovered, such that the 2024 ridership is 84.1% of what it was in 2018. Ridership on SEPTA bus routes serving Chester County also decreased, but has not yet returned to pre-pandemic levels. Their 2024 ridership is 79.7% of what it was in 2018. SEPTA rail ridership remains far less than it was pre-pandemic. The most current ridership data from 2023 is 46.5% of what it was in 2019.
- Ongoing long-term changes in the housing market are also reflected in the metrics. The percentage of new housing units that are apartments continues to be notably higher than in the 2000s or 2010s, although that percentage is still smaller than owner-occupied units. Housing assessment values in the boroughs and the City of Coatesville continue to rise at a strong pace, which was not always the case in past decades.
- The protection of open space, and the establishment of recreational parks and trails is continuing at a strong pace. There tend to be fewer large acreage projects because many of the larger properties have already been protected.
All metrics are listed below.
Preserve Metrics
Advance the protection and stewardship of open space, farmland, and natural and cultural features to realize economic, ecological, and quality of life benefits.
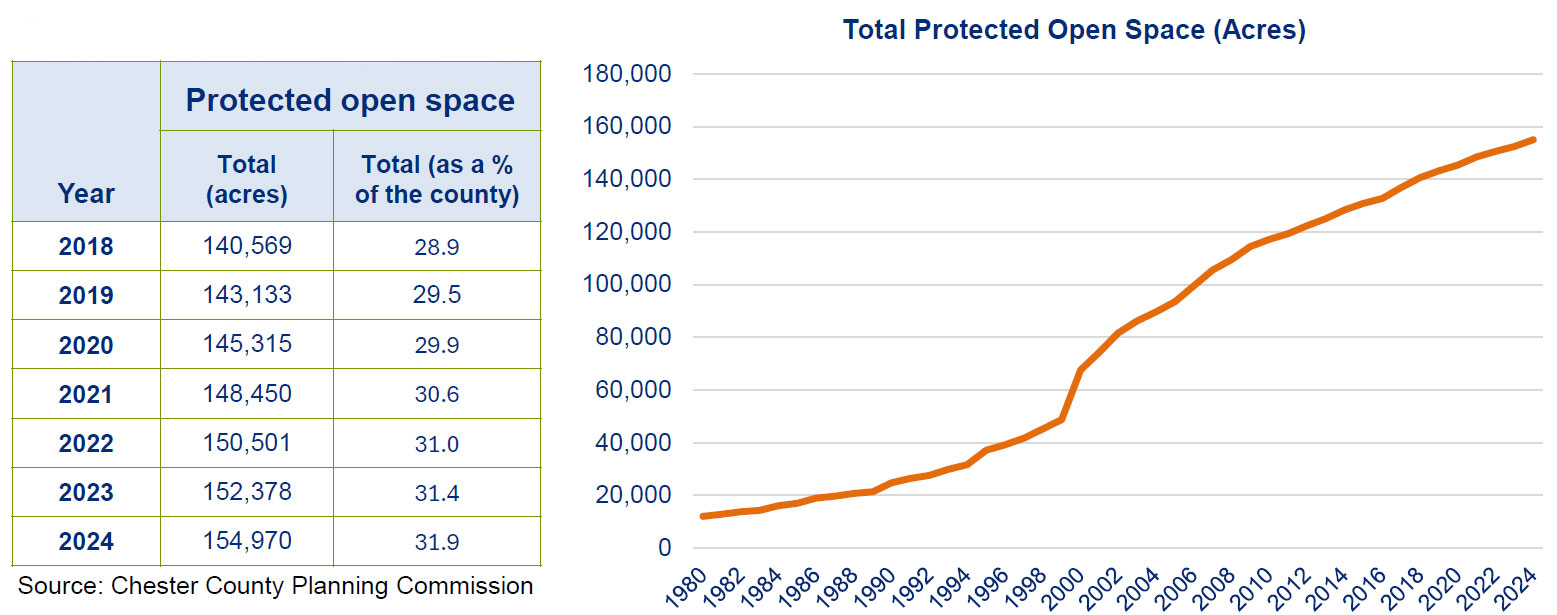
Metric 1 — Protected Open Space
Track the percentage of permanently protected open space within the county, including farmland, nature preserves and parks.
Metric Results
In 2024, the amount of protected open space increased by 2,592 acres, which is consistent with the past six years, when increases typically ranged from 2,000 to 3,000 acres.
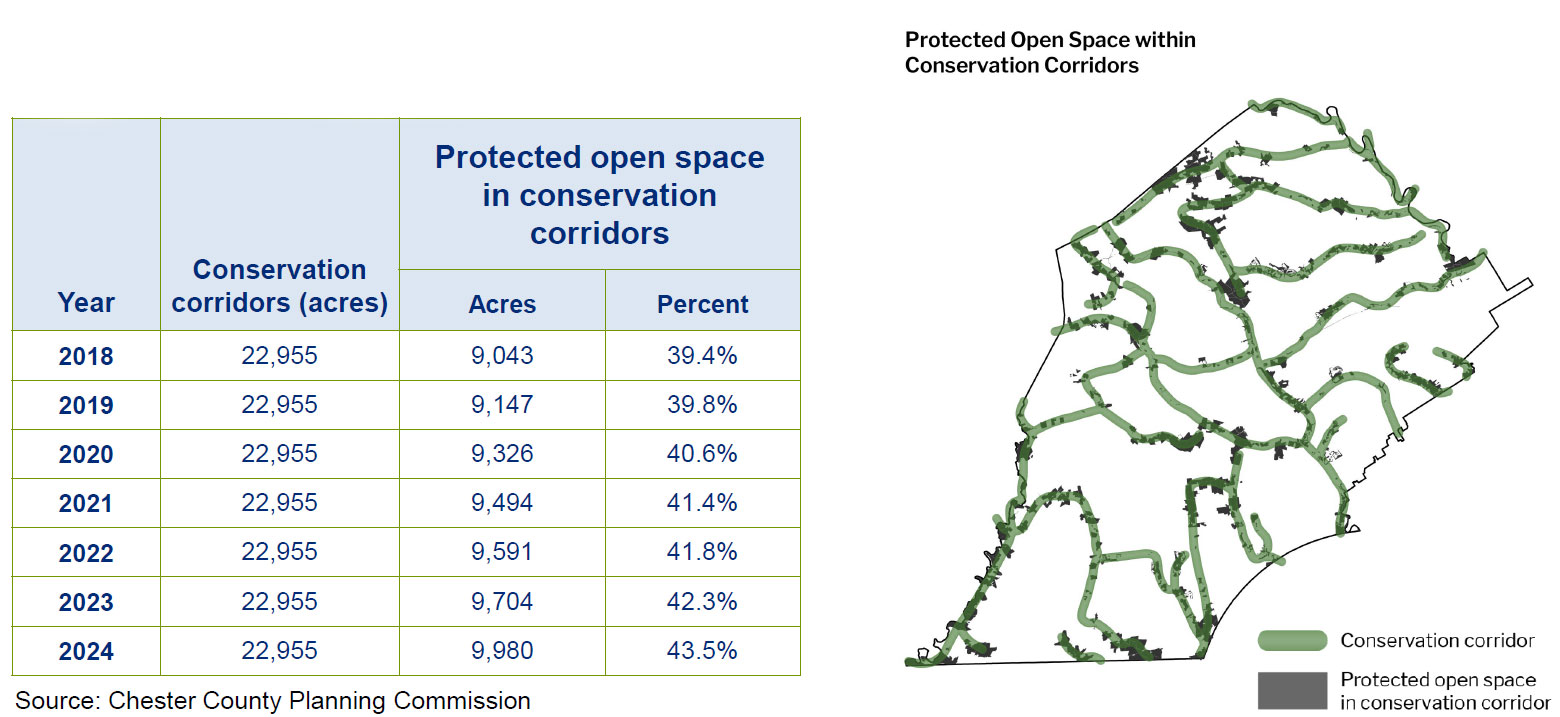
Metric 2 — Open Space Connectivity
Monitor protected open space within the conservation corridors.
Metric Results
In 2024, the amount of protected open spaces located within connectivity corridors increased by 276 acres. This is somewhat higher than in the past five years, when increases typically ranged from between 100 and 200 acres.
Metric 3 — Viable and Protected Farmland
Track the percentage of viable farmland that is eligible for an agricultural conservation easement and has been protected from development.
Metric Results
In 2024, the amount of viable farmland decreased by 141 acres, which is less than in most of the past five years when it ranged from 1,000 to 2,000 acres. This loss was mostly due to development. The increase in protected farmland was 4,739, which is more than in most past years when it ranged from 1,000 to 2,000 acres. This farmland was protected by county and private easement programs, some of which permit fields and pasture to eventually be rewilded. Thus, some of these farmlands may become natural areas at some future date.

Protect Metrics
Protect and restore critical natural resources to ensure a resilient environment that supports healthy communities.
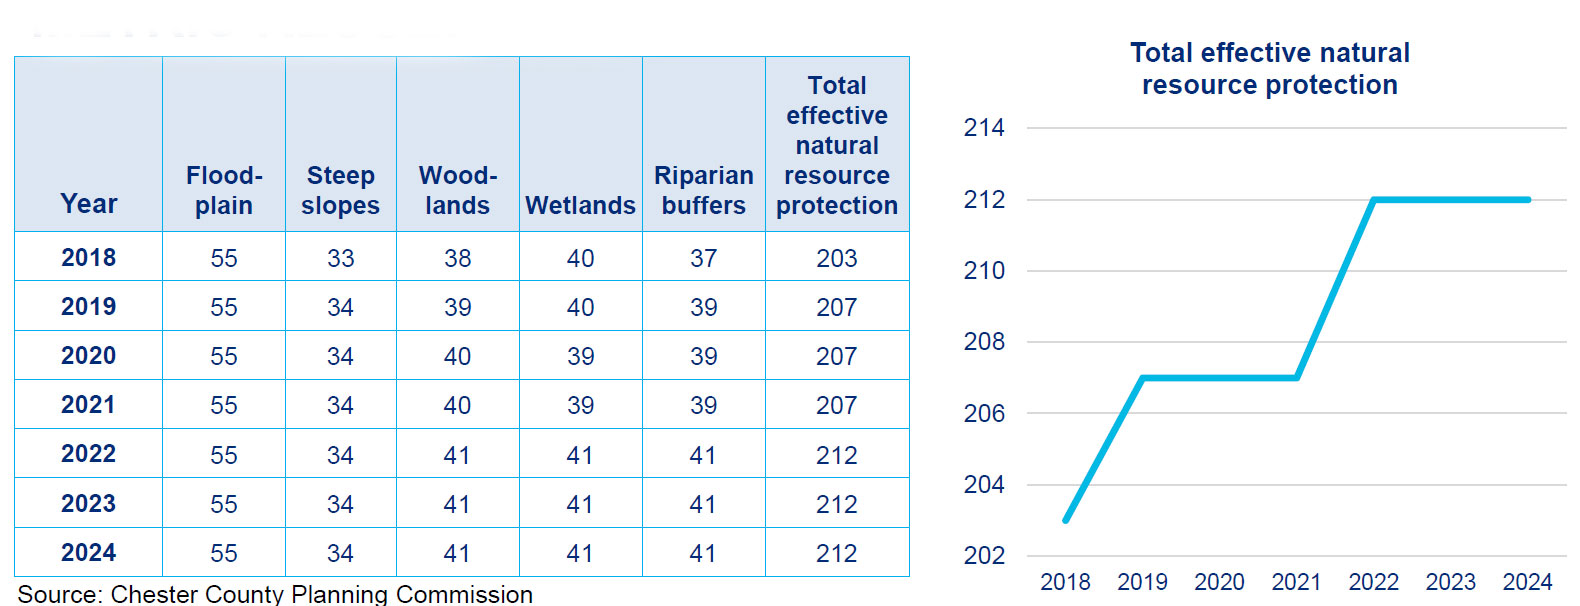
Metric 4 — Natural Resource Protection
Track the number of adopted municipal ordinance regulations that effectively protect natural resources.
Metric Results
There was no change for 2024. Since 2018, the total number of natural resource protection ordinances has increased modestly. This trend can be partially attributed to many of the county's municipalities having already updated such ordinances in the 2000s and 2010s.
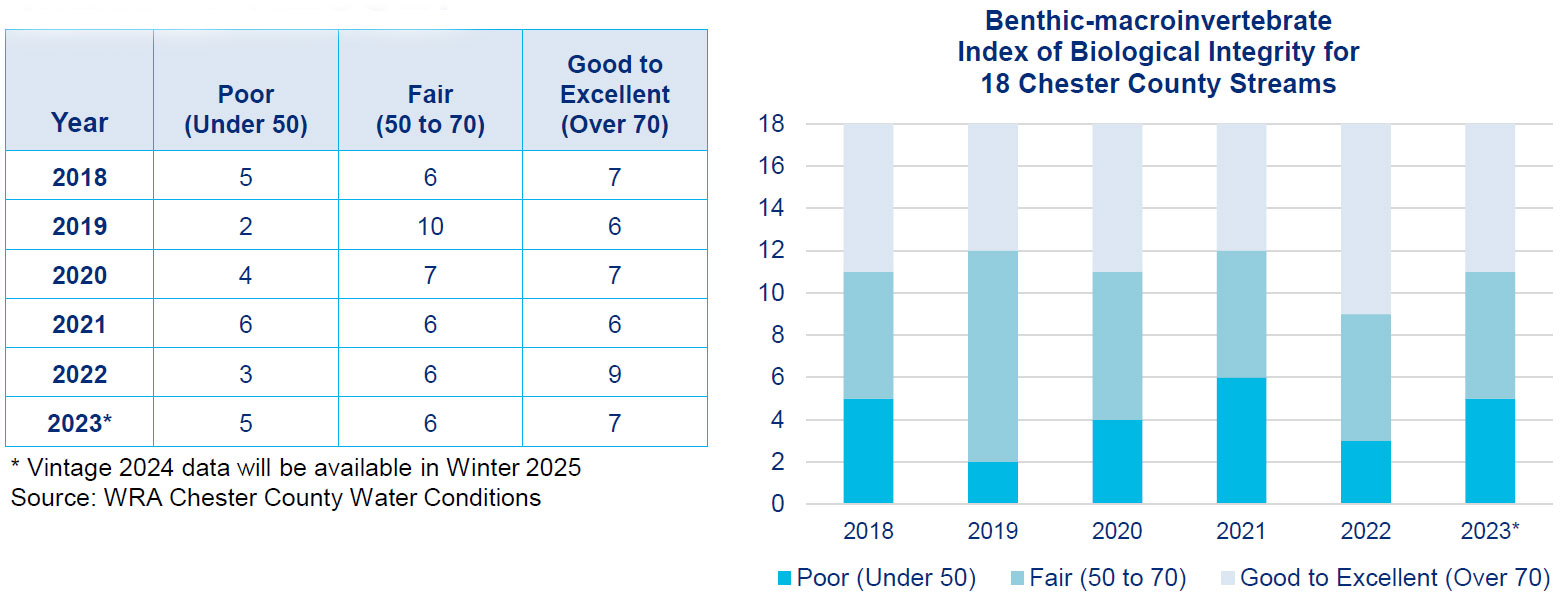
Metric 5 — Stream Health
Monitor aquatic life diversity as an indicator of overall stream health.
Metric Results
In 2024, the number of streams with good to excellent health, based on the Benthic-macroinvertebrate Index, has remained relatively constant since 2018. These fluctuations indicate that climate conditions, like rainfall and overall temperatures, are impacting stream health more than changing land use conditions.
Appreciate Metrics
Preserve the historic resources and landscapes that define our cultural heritage to inspire the future through tangible connections to our shared past.
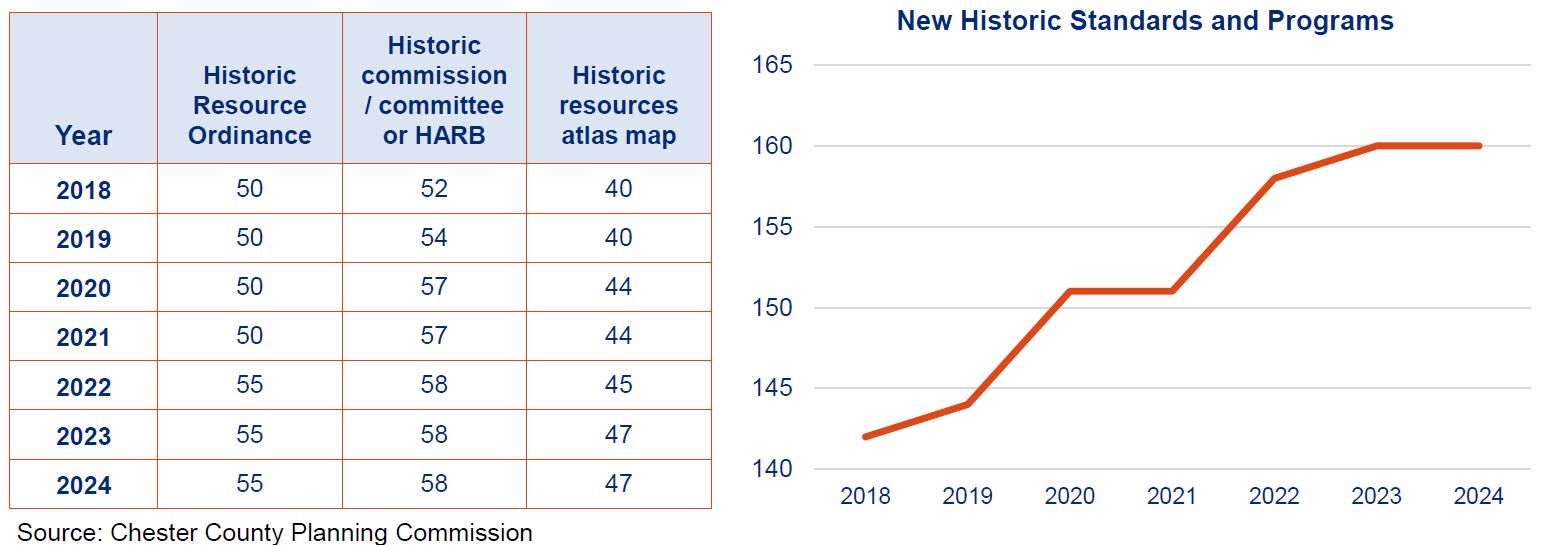
Metric 6 — Historic Inventory and Standards
Track the number of municipal comprehensive historic resource protection measures implemented.
Metric Results
There was no change for 2024. Since 2018, the total number of historic inventories and standards has shown little change. This trend can be partially attributed to many of the county's municipalities having already updated such ordinances in the 2000's and 2010s.
Metric 7 — Historic Tourism
Track the level of tourism within the county related to historic and cultural resources.
Metric Results
In 2024, total attendance at four key cultural-heritage tourism sites (Hibernia County Park and Mansion, Springton Manor Farm, Historic Yellow Springs, and Hopewell Furnace National Historic Park), remained above 450,000, a modest decrease from 2023. During COVID, attendance dropped to below 350,000 and, with the exception of 2024, has been gradually rising since then.

Live Metrics
Nurture diverse and well-rounded communities with a balance of residential opportunities and convenient access to community facilities, services, and amenities.
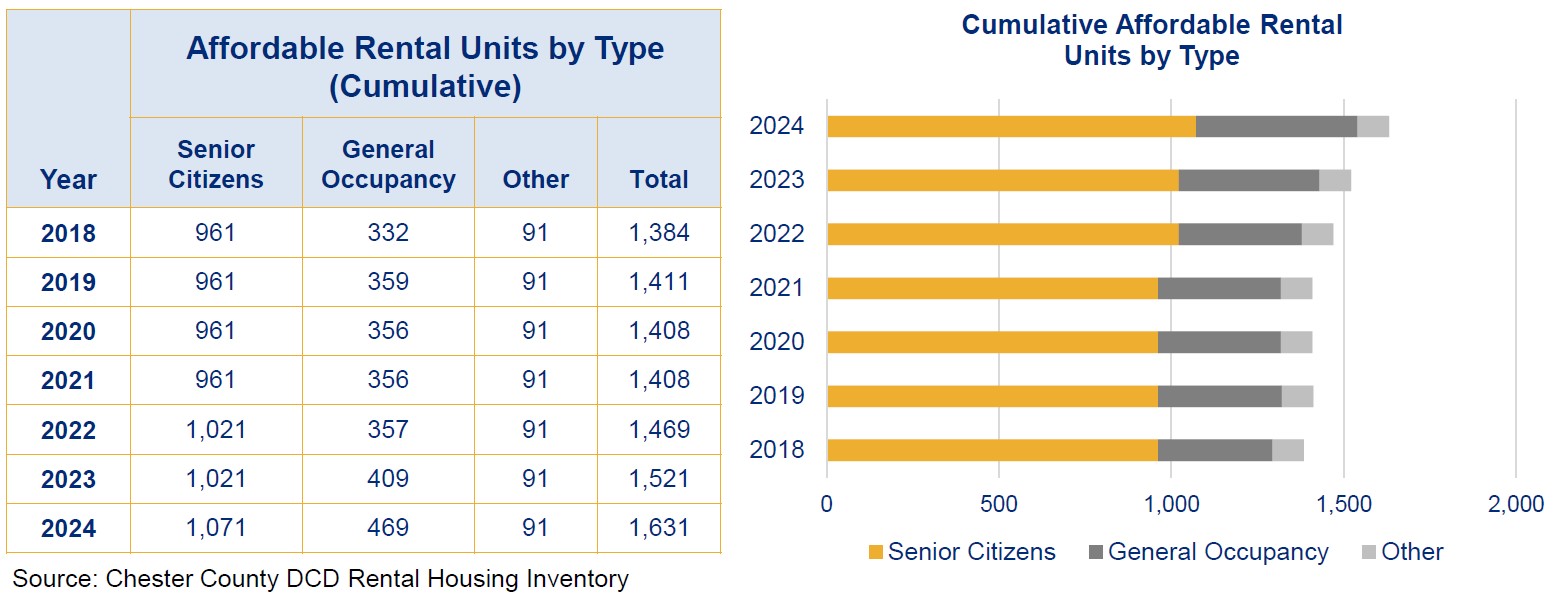
Metric 8 — Affordable Housing Built
Track the number of built or rehabbed affordable units subsidized by the county.
Metric Results
The total number of rental units which are designated as affordable housing by the Chester County Department of Community Development grew by 110 in 2024. It has gradually risen since 2018, from 1,384 to 1,631 in 2024.
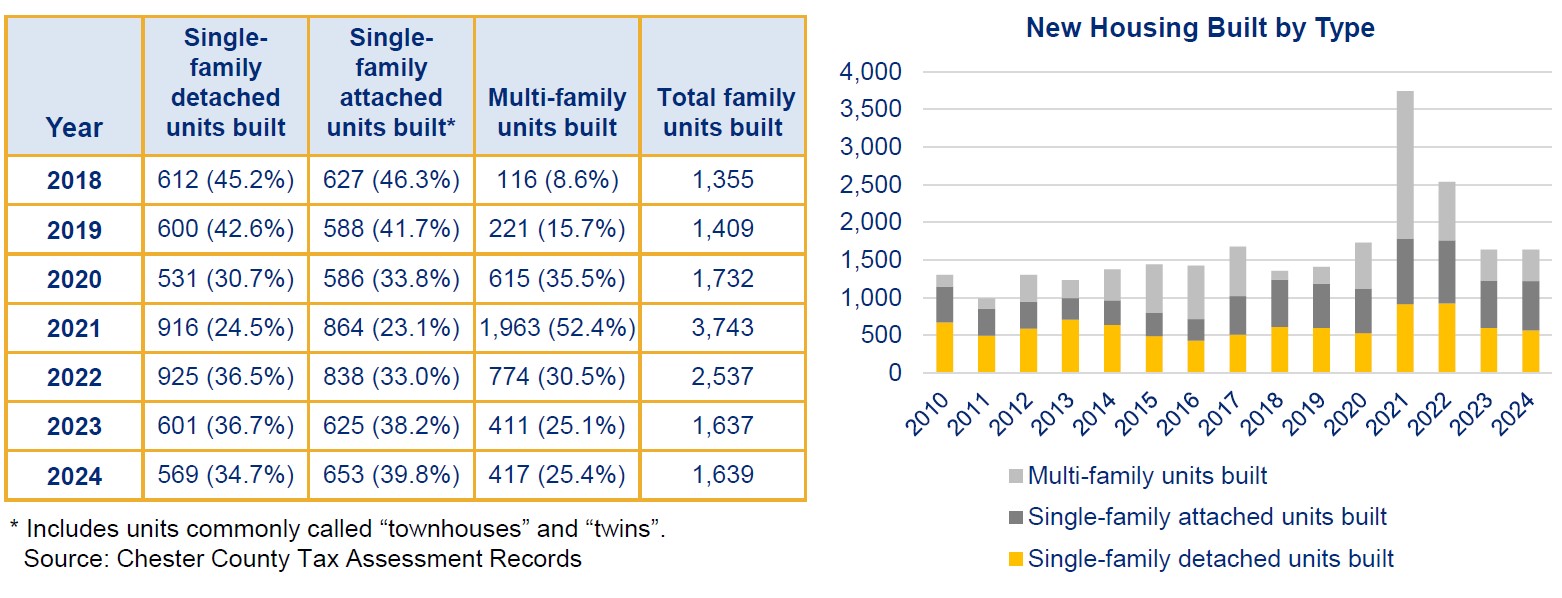
Metric 9 — Housing Diversity
Track the types of housing constructed in the county.
Metric Results
For 2024, the distribution of new units built by type were 35% single-family detached, 40% single family attached, and 25% multi-family units. This continues a trend that began in 2020, in which new units were roughly one third single-family detached, one-third single family attached, and one third multi-family units. Prior to 2020, multi-family units were a significantly smaller percentage of the housing mix.
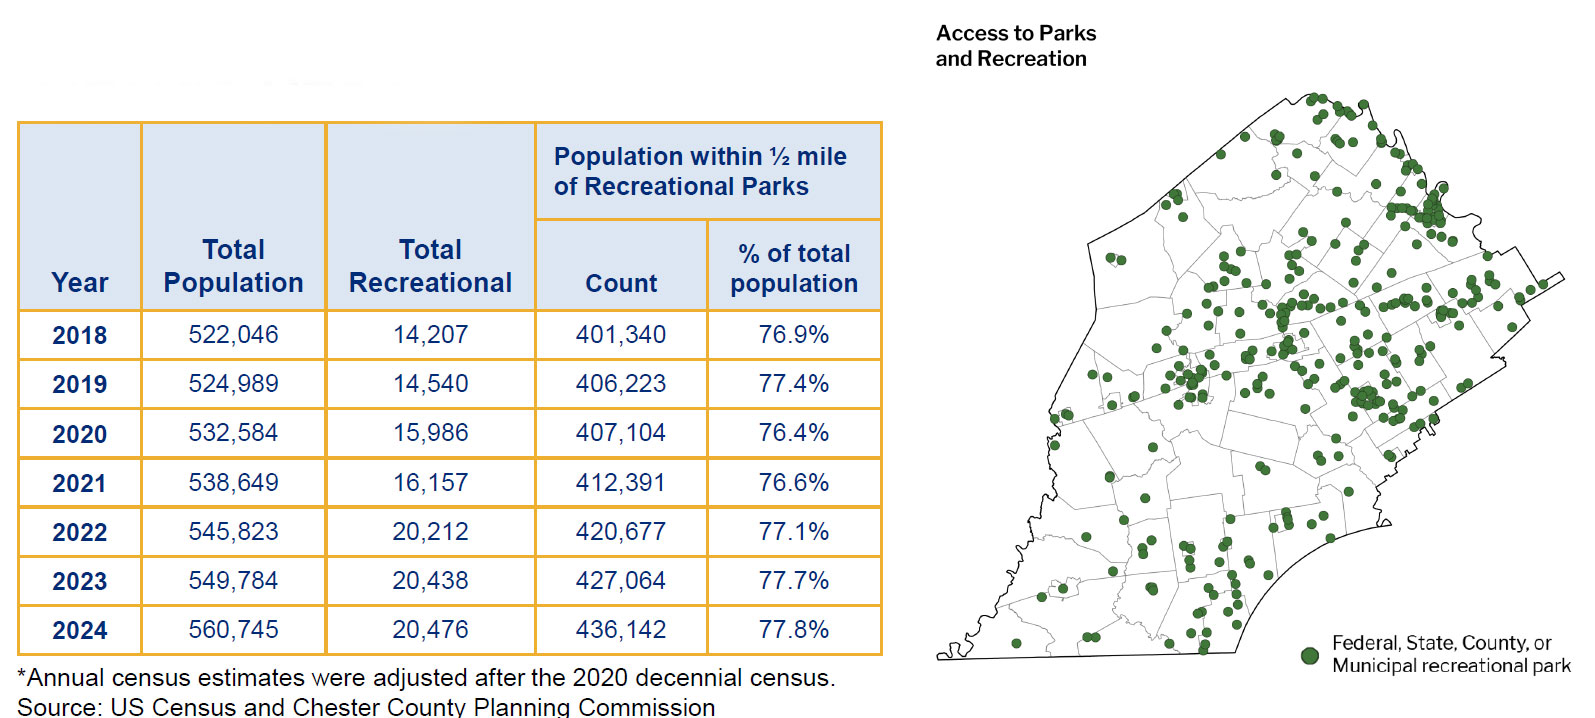
Metric 10 — Access to Parks
Monitor the percentage of residents living near public park and recreation facilities.
Metric Results
For 2024, the population within one-half mile of a recreational park rose by 9,078. Since 2018, the population within one-half mile of a recreational park has gradually increased from 401,340 to 436,142, which is 77.8% of the total population. Generally speaking, newly established or newly expanded recreational parks in Western Chester County raise the number of park users, because there are fewer existing parks in this area. In Eastern Chester County, it is more likely that new parks will be within one-half mile of areas already served by a park.
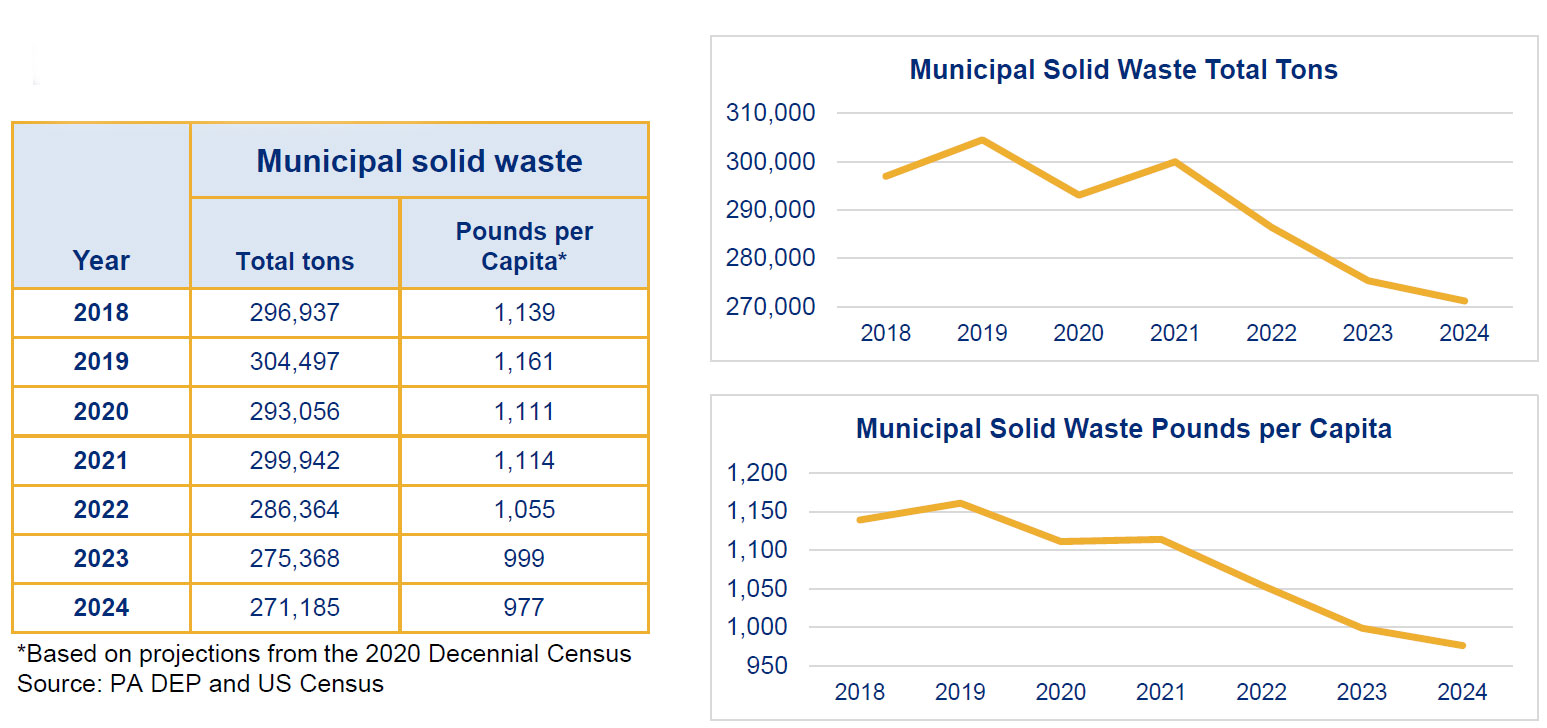
Metric 11 — Solid Waste
Track the amount of municipal waste per capita.
Metric Results
From 2018 to 2020, the tonnage of "municipal" solid waste (which is basic household waste) hovered around 300,000 tons. Since then, it gradually dropped to 271,185 in 2024 despite an increase in the population. A similar change occurred with the per capita pounds of waste. This indicates that despite a rise in population, individual households are generating less waste, which can be attributed to recycling, reuse, or reduction in use.
Prosper Metrics
Grow our economic strength through developing and sustaining a skilled workforce, adaptable work areas, supportive infrastructure, a culture of innovation, and engaged communities.
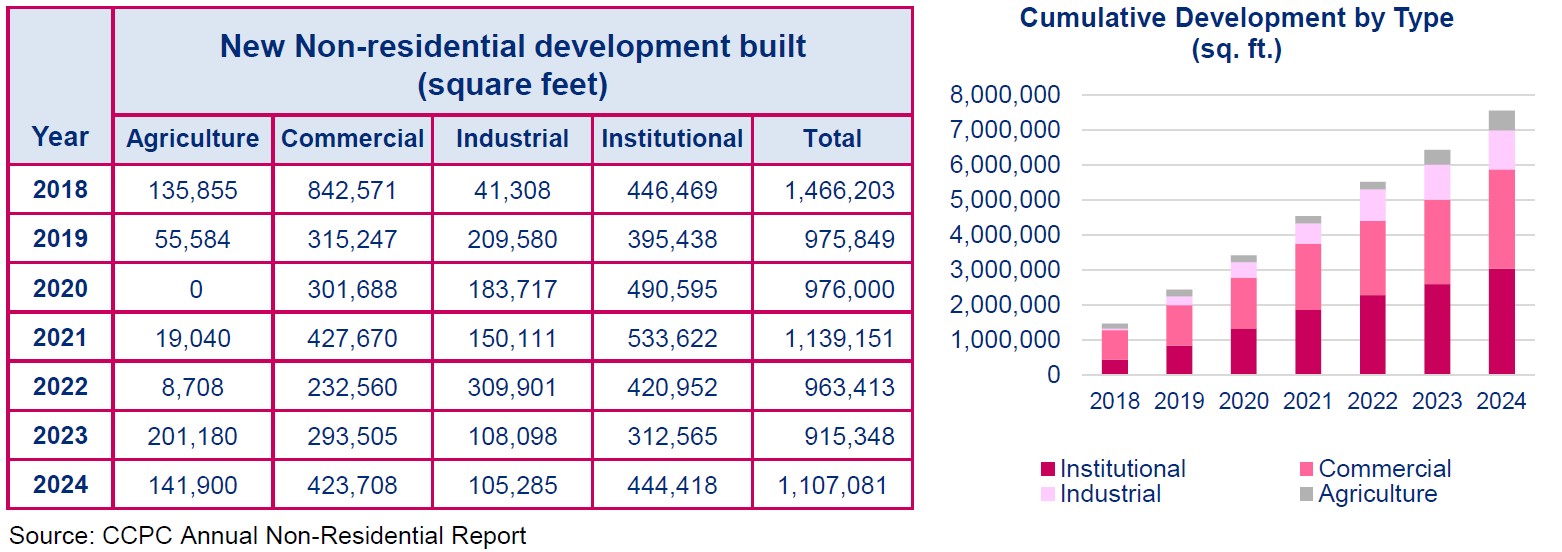
Metric 12 — Non-Residential Development
Track the amount of non-residential development.
Metric Results
For 2024, newly built non-residential development exceeded 1.1 million square feet, of which over 70% was either commercial or institutional. There has been a continuing rise in non-residential development built since 2018. Agriculture development increased by over 560,000 square feet, industrial development increased by over 1.1 million square feet, commercial development increased by over 2.8 million, and institutional increased by over 3.0 million.
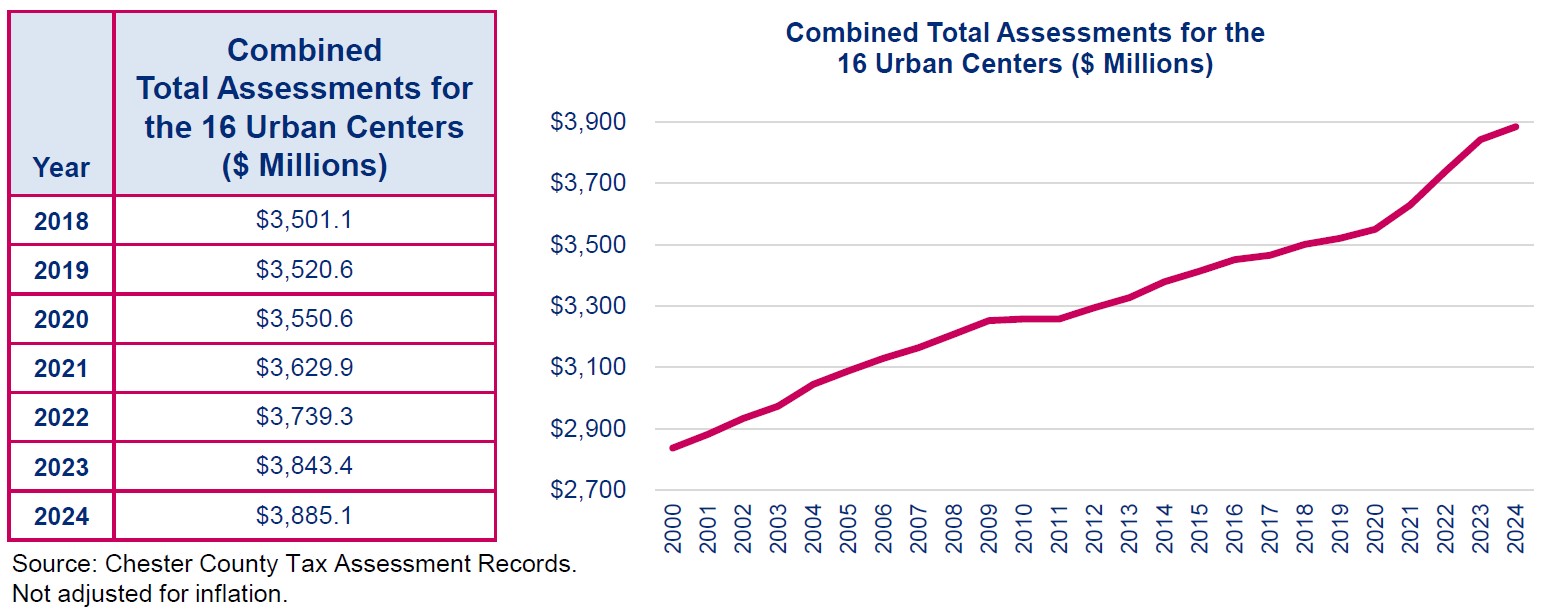
Metric 13 — Urban Center Prosperity
Monitor taxable assessments in urban centers to track economic and community prosperity.
Metric Results
Since 2000, the total assessment of Chester County's 16 urban centers continued to increase. This reflects the continued and increasing interest in development and re-development in urban centers. From 2021 through 2023, however, the increase rose at a faster pace, which may be due to the completion of projects stalled during the pandemic combined with interest in urban development. In 2024, there was somewhat of a cooling of assessment values, although urban development is still strong.
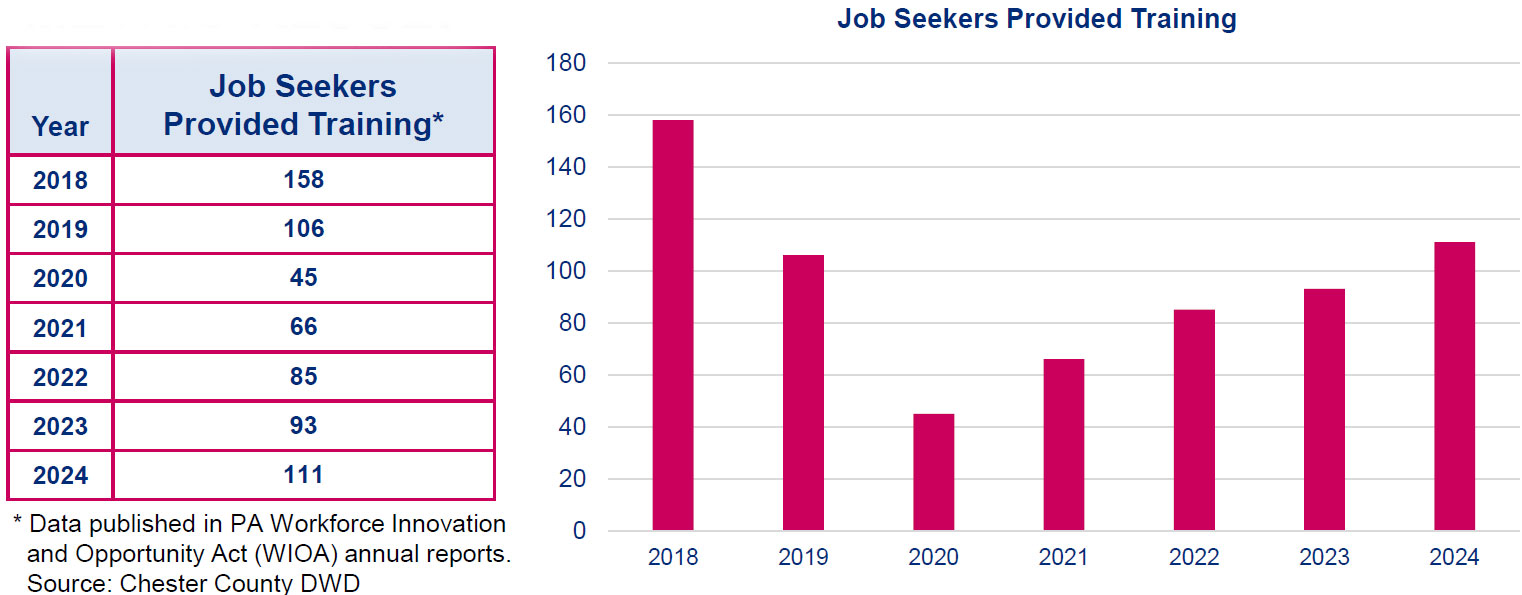
Metric 14 — Workforce Development Progress
Track the number of people assisted with employment training by the county.
Metric Results
The number of job seekers who were provided with training by Chester County programs was over 150 in 2018. Those numbers dropped to less than 50 during the pandemic, but have gradually recovered to over 100 in 2024.
Connect Metrics
Advance efficient, reliable, and innovative transportation, utility, and communications infrastructure systems that responsibly serve thriving and growing communities.
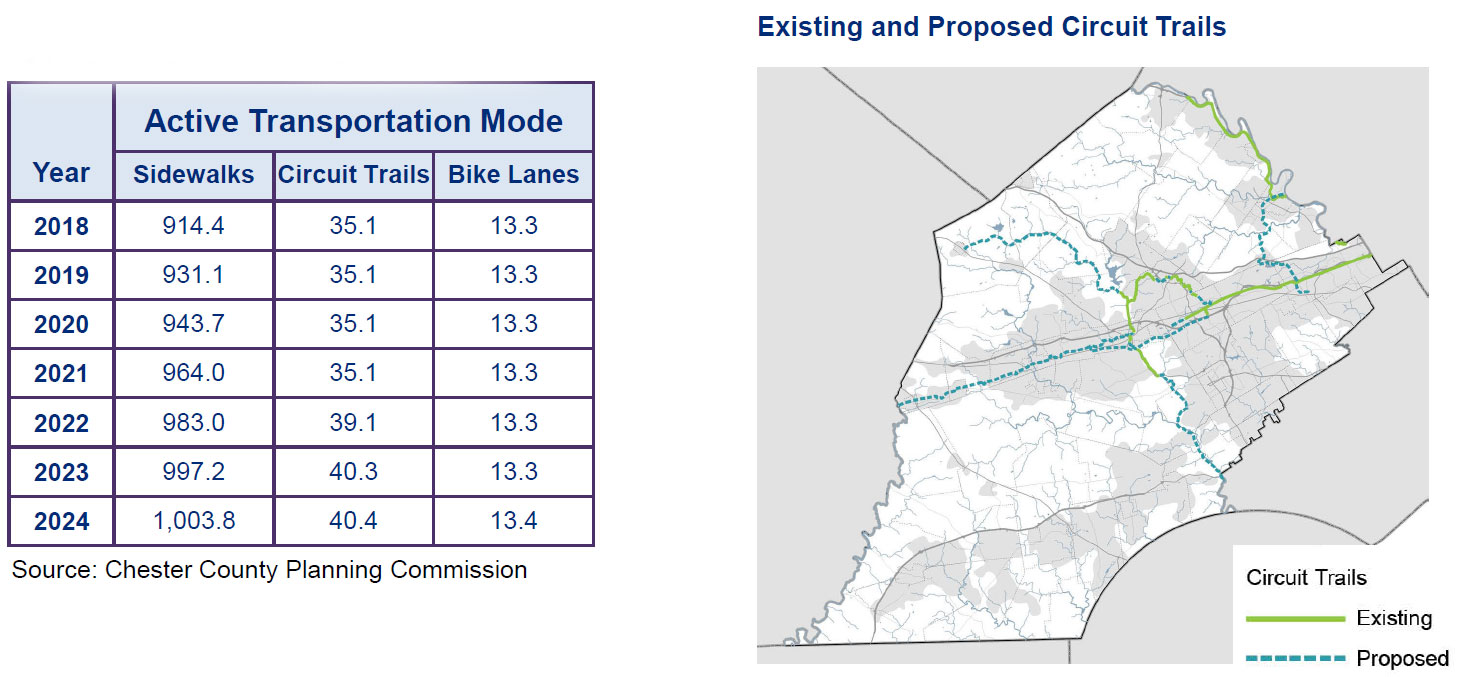
Metric 15 — Active Transportation
Track the length of new multi-use trails, sidewalks, and bike lanes created in the county.
Metric Results
Since 2018 the length of trails located withing the DVRPC Circuit Trail Corridors gradually rose from 35 to 40 miles. There were 0.1 miles added in 2024. Similarly, sidewalks gradually rose from 914 to 1,003 miles, an addition of 6.6 miles for 2024. Bike lanes had remained unchanged from 2018, until 2024 when they saw a minor increase from 13.3 to 13.4 miles.
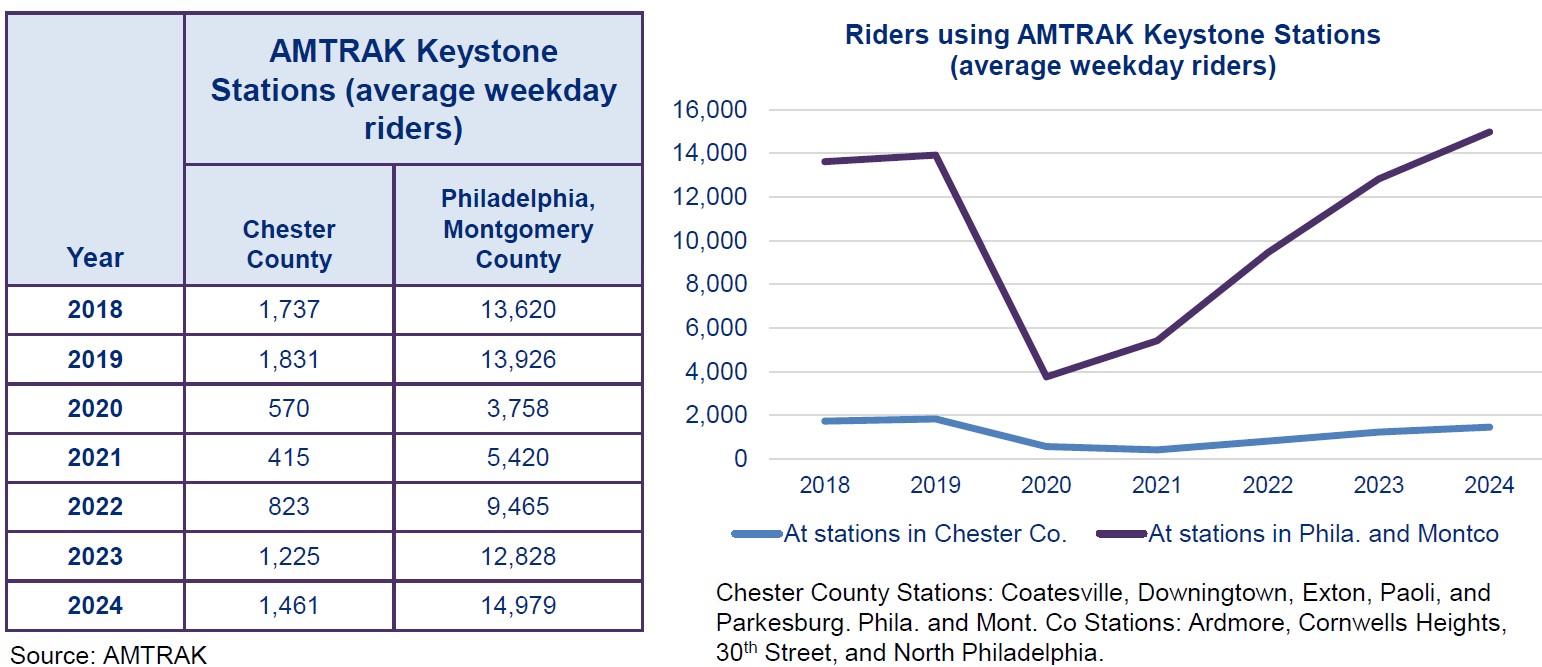
Metric 16 — Public Transportation
Track transit ridership trips within the county including bus routes, regional rail service, and AMTRAK.
Metric Results
AMTRAK ridership for Chester County dropped during the pandemic. Ridership, which was 1,738 in 2018, dropped to 415 in 2021. But by 2024, it has nearly recovered to 1,461. The 2024 ridership is 84.1% of what it was in 2018. During the pandemic, SEPTA bus routes that extend into Chester County decreased from over 9,800 average weekday riders to under 4,000. There has since been a gradual recovery to 7,827 riders. Their 2024 ridership is 79.7% of what it was in 2018. There is limited data on SEPTA commuter rail ridership, but available data suggests that average daily ridership is still far less than what it was pre-pandemic. The most current ridership data from 2023 is 46.5% of what it was in 2019. This change is likely influenced by Chester County residents who previously commuted daily to Philadelphia, but now have a full- or part-time remote work schedule.

Metric 17 — Improved Travel Time
Monitor the average travel time on selected major highways during peak hours on weekdays.
Metric Results
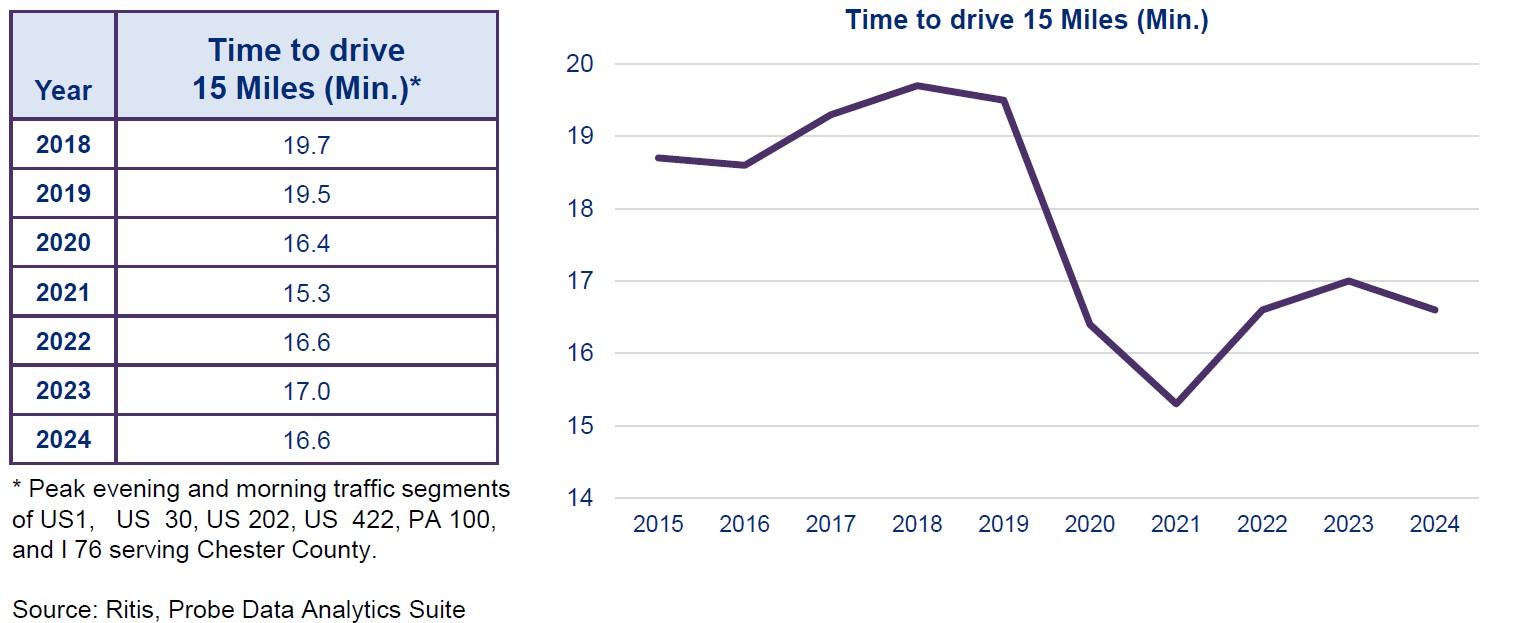
For 2024, the time needed to travel 15 miles in Chester County was 16.6 minutes, a modest drop from 2023 when it was 17.0. As a result of the pandemic, the time needed to travel 15 miles in Chester County dropped from over 19 minutes in 2018 to under 16 in 2021. Since 2021, the commute time rose, but it still ranges between 16 and 17 minutes. This is almost certainly due to an increase in remote work and fewer people on the road during traditional commuting times.
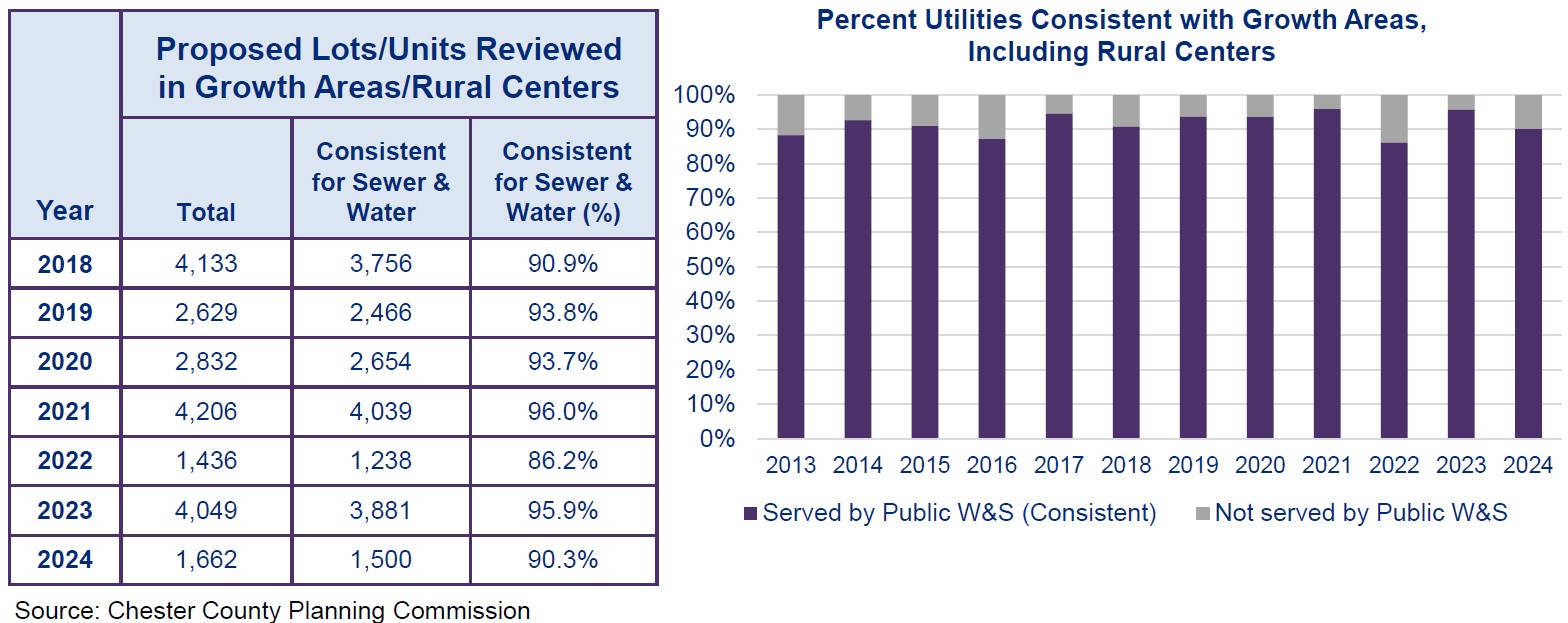
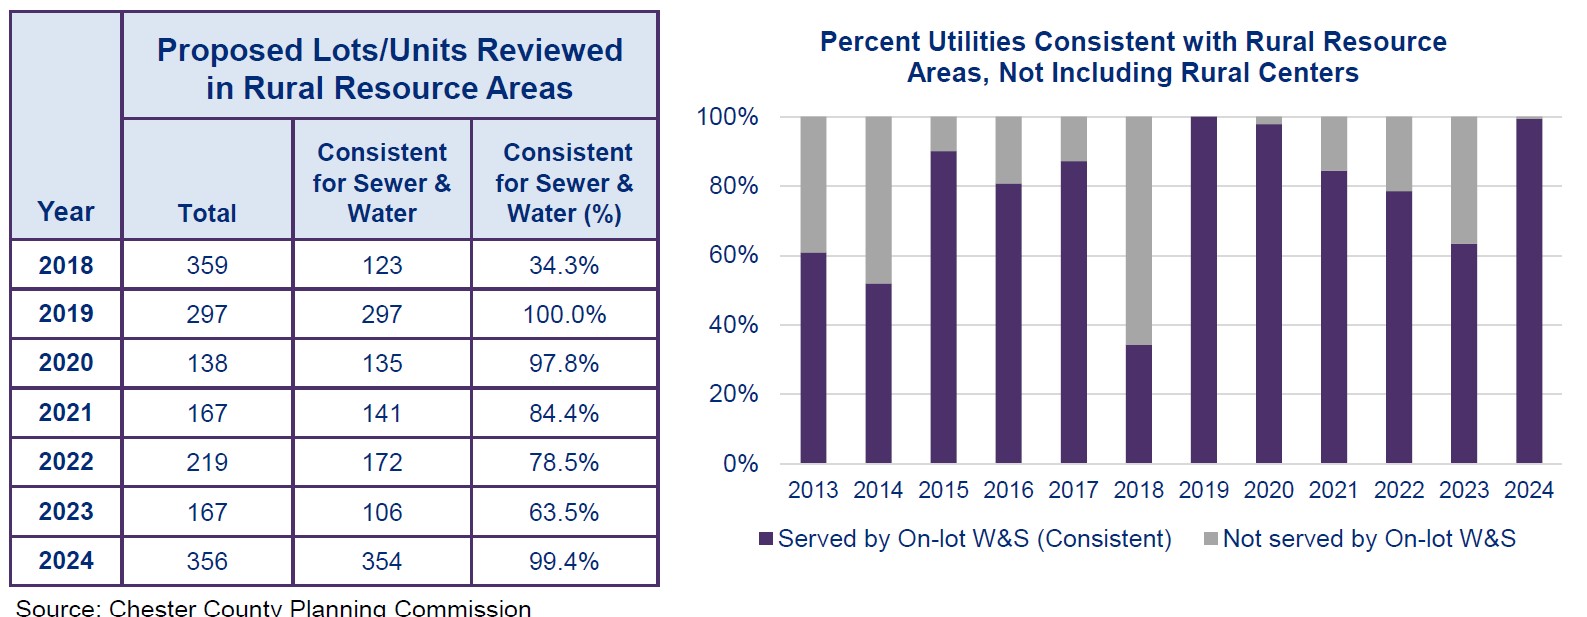
Metric 18 — Coordinating Utilities with Growth Areas
Track development units connecting to public sewer and water services that will be located in designated growth areas.
Metric Results
Since 2018, the percentage of proposed units that are consistent with Landscapes3 in terms of both public sewer and water service, has steadily grown. For this metric to be consistent with Landscapes3, a development in a growth area should use public water and sewer systems. In 2024, 90.3% of growth area proposals were consistent. This follows a general trend dating back to 2018, in which consistency is typically at or above 90%. For this metric, a development in a rural or agriculture landscape should use an on-lot sewer system and private well water. In 2024, 99.4% of growth area proposals were consistent. However, data from 2018 to 2024 show that consistency changes from year to year, sometimes dipping into the range of 50 to 70%. This is likely due to sewer lines being extended out from growth areas and into rural areas.