Measuring Success
How we CONNECT
2023
METRIC 15
Active Transportation
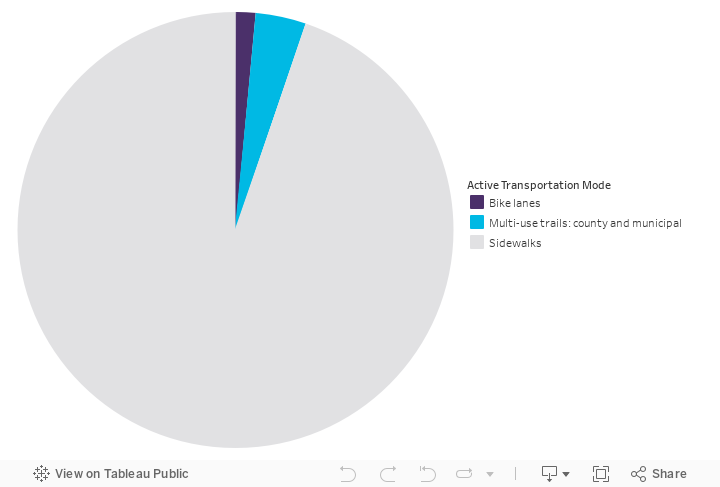
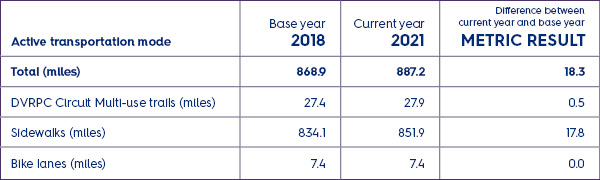
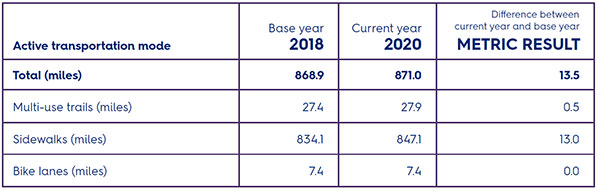
Track the length of new multi-use trails, sidewalks, and bike lanes created in the county.
METRIC result
Since 2018, there has been a steady increase in sidewalks as new developments are built. Although many trails have been built in the county, only about 5 miles were built within the DVRPC Circuit Corridor. Bike Lanes have not grown, partly because the county has ample low volume roadways popular with bicyclists, and partly because of narrow roadways with no room.

Existing and Proposed Circuit Trails

METRIC 16
Public Transportation
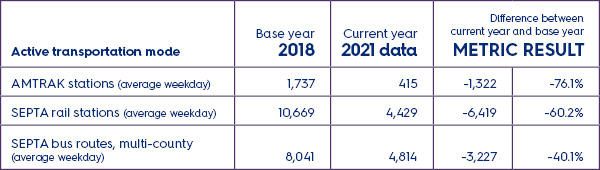
Track transit ridership trips within the county including bus routes, regional rail service, and AMTRAK.
METRIC result
During the COVID epidemic, ridership dropped on all modes of public transportation. The percentage of the decrease was less in Chester County relative to the region. Ridership locally and regionally has yet to fully recover. It may be several years before any permanent impact can be determined.

SEPTA Bus Ridership
AMTRAK Ridership
* SEPTA rail ridership has not been enumerated on an annual basis.
METRIC 17
Improved Travel Time
Monitor the average travel time on selected major highways during peak hours on weekdays.
METRIC result
As a result of the COVID epidemic, the number of Chester County residents who worked from home increased. The result was fewer commuters on the road, which reduced traffic congestion and led to faster commutes. Since 2022, more workers have been spending time in the office, and so commuting times have risen, but not to pre-COVID levels.

Time to Drive 15 Miles (minutes)
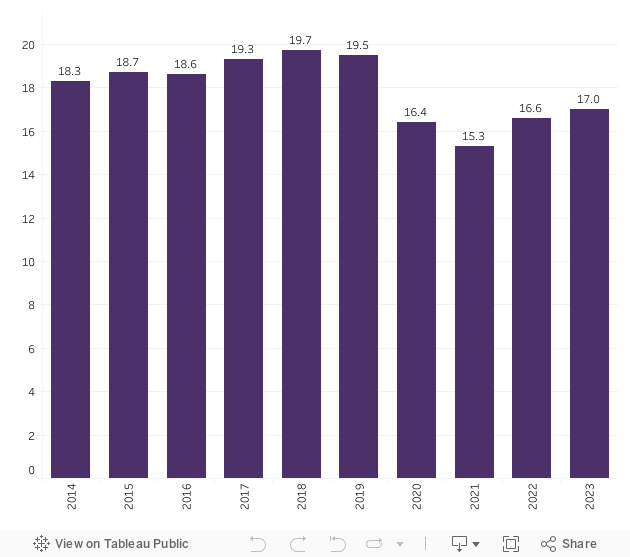
Travel time is measured each year along the following major roadways in Chester County: PA 100, US 1, US 30, US 422, US 202, and I-76 (the PA Turnpike).
METRIC 18
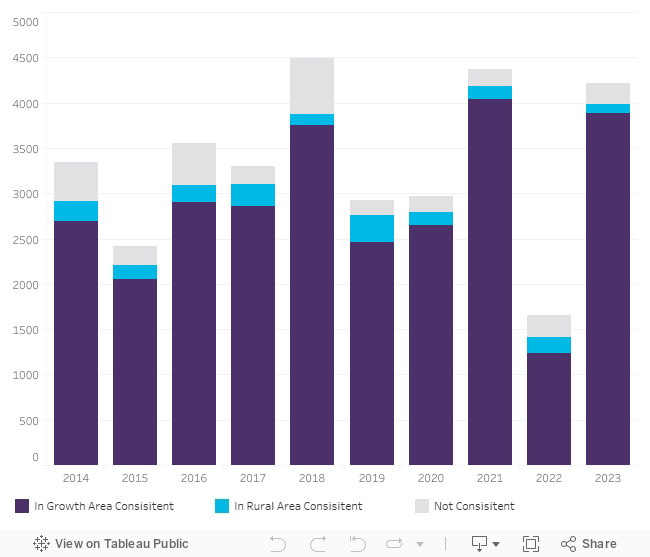
Coordinating Utilities with Growth Areas
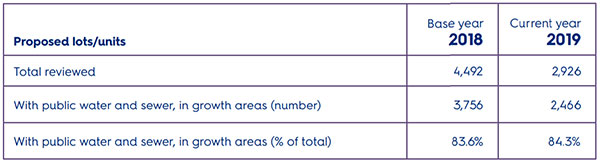
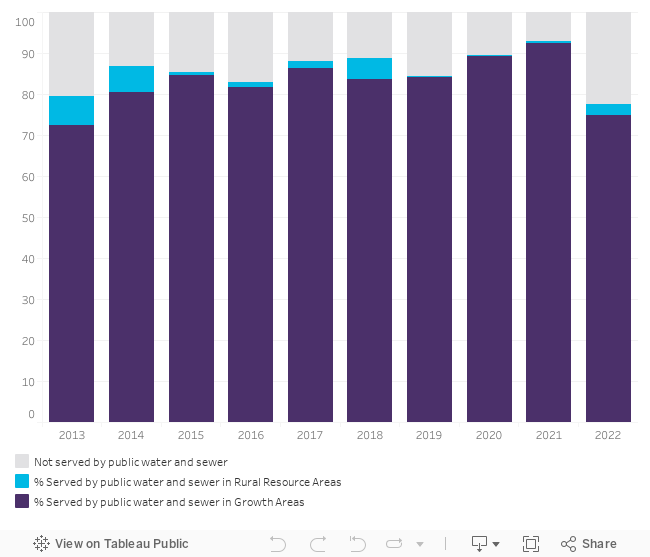
Track development units connecting to public sewer and water services that will be located in designated growth areas.
METRIC result
Since 2018, there has been an increase in the consistency of reviewed plans in terms of public sewer and water service. In Growth Areas, consistency means that public water and sewer service is proposed. In Rural Areas, consistency means on-lot systems and wells.

Utility Consistency (number of reviews)
2022
METRIC 15
Active Transportation
Track the length of new multi-use trails, sidewalks, and bike lanes created in the county.
METRIC result
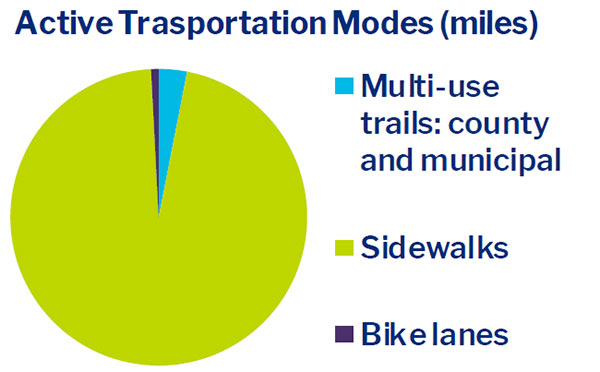
This metric measures the combined length of on-road bike lanes, sidewalks, and county and municipal multi-use trails (traveled by both pedestrians and bicyclists) open for public use. During 2022, this this metric was 967.5 miles. This amount represents an increase of 96.5 mile relative to the base year.
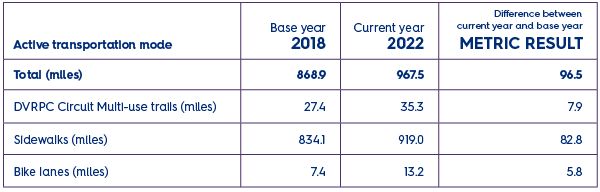
Active Transportation Modes (miles)
METRIC 16
Public Transportation
Track transit ridership trips within the county including bus routes, regional rail service, and AMTRAK.
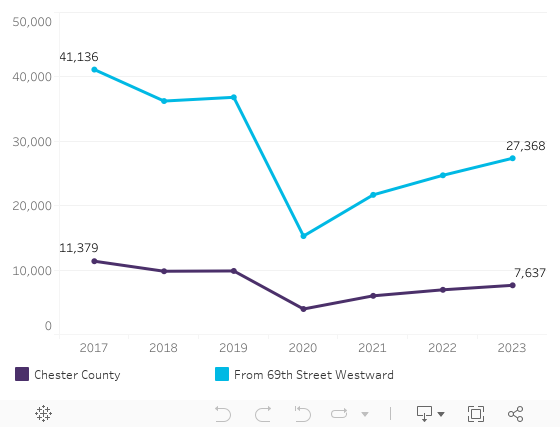
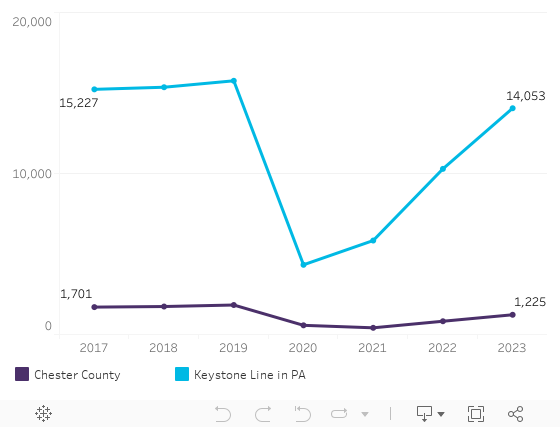
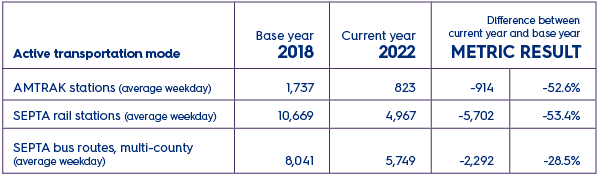
METRIC result
This metric measures the average weekday ridership for three key public trait providers, AMTRAK, SEPTA Commuter Rail, and SEPTA Bus Routes. During 2022, AMTRAK ridership was 823, a drop of 52.6% from the base year. SEPTA Rail ridership was 4,967, a drop of 53.4%. SEPTA Bus ridership was 5,749, a drop of 28.5%.
SEPTA Commuter Rail Total Monthly Trips
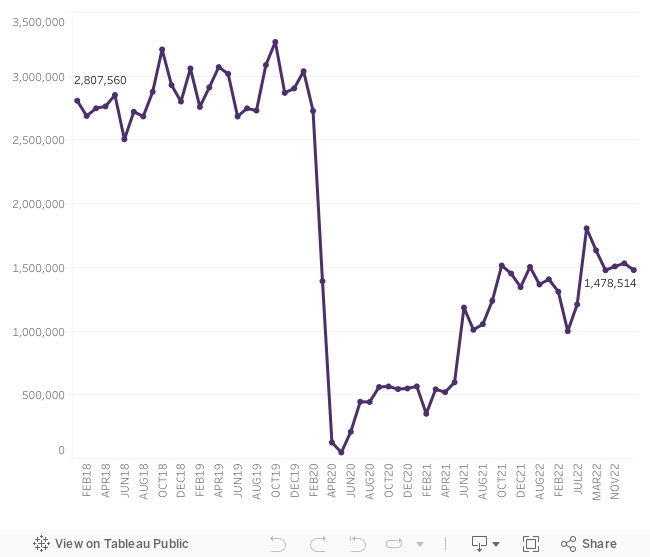
This graph shows the ridership of the entire SEPTA Commuter Rail system through the Philadelphia Region. It documents the systemwide impact of COVID on SEPTA's commuter rail, which has also impacted Chester County.
METRIC 17
Improved Travel Time
Monitor the average travel time on selected major highways during peak hours on weekdays.
METRIC result
This metric measures the average amount of time needed to drive 15-miles on six of the county's major roadways during peak weekday hours. During 2022, the time was 16.6 minutes. This represents a reduction of 3.1 minutes relative to the base year.

Time to Drive 15 Miles (minutes)
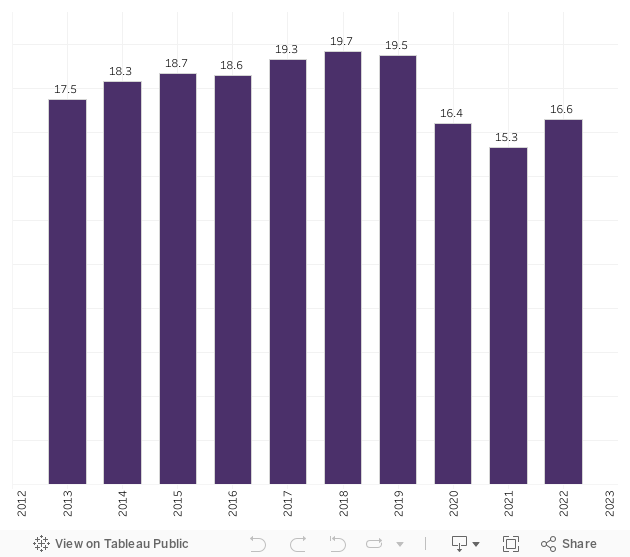
Travel time is measured each year along the following major roadways in Chester County: PA 100, US 1, US 30, US 422, US 202, and I-76 (the PA Turnpike).
METRIC 18
Coordinating Utilities with Growth Areas
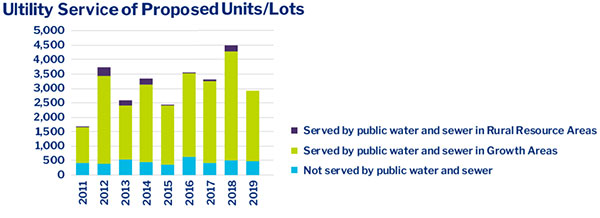
Track development units connecting to public sewer and water services that will be located in designated growth areas.
METRIC result
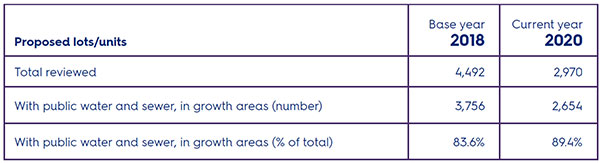
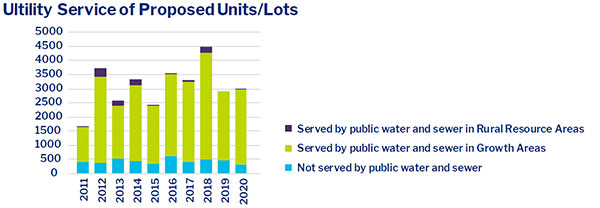
This metric measures the number of proposed lots and units within growth areas that are designed to be served by both public sewer and public water. The data source for this metric is all proposed lots and units that were reviewed by the Planning Commission. During 2022, the number of such lots and units was 1,238 (or 78.4% of all lots and units reviewed.)
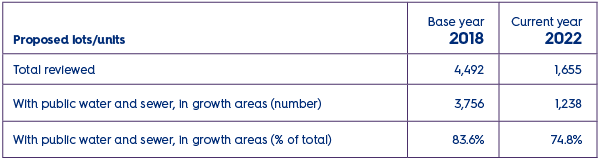
Utility Service of Proposed Units/Lots
2021
METRIC 15
Active Transportation
Track the length of new multi-use trails, sidewalks, and bike lanes created in the county.
METRIC result
Since the base year (2018), a total of 18.3 miles of new on-road bike lanes, sidewalks, and county and municipal multi-use trails (traveled by both pedestrians and bicyclists) were opened for public use. This represents an increase of 2.1% relative to the base year.

METRIC 16
Public Transportation
Track transit ridership trips within the county including bus routes, regional rail service, and AMTRAK.
METRIC result
The way transit ridership is enumerated is undergoing changes. Updated technologies have improved gathering bus ridership data. SEPTA rail still relies on a ridership census conducted every two years, and estimates based on ticket sales data. The graphic to the left documents the systemwide impact of COVID on SEPTA's commuter rail, which has also impacted Chester County.
METRIC 17
Improved Travel Time
Monitor the average travel time on selected major highways during peak hours on weekdays.
METRIC result
Compared to the base year (2018), the average amount of time needed for a 15-mile trip on six of the major roadways during peak weekday hours in the county has been reduced by 4.4 minutes.


Travel time is measured each year along the following major roadways in Chester County: PA 100, US 1, US 30, US 422, US 202, and I-76 (the PA Turnpike).
METRIC 18
Coordinating Utilities with Growth Areas
Track development units connecting to public sewer and water services that will be located in designated growth areas.
METRIC result
During the current year (2021), 92.4% of all proposed lots or units reviewed were to be served by both public sewer and public water. This represents a modest increase from the base year (2018).

2020
METRIC 15
Active Transportation
Track the length of new multi-use trails, sidewalks, and bike lanes created in the county.
METRIC result
Since the base year (2018), a total of 13.5 miles of new on-road bike lanes, sidewalks, and county and municipal multi-use trails (traveled by both pedestrians and bicyclists) were opened for public use. This represents an increase of 1.6% relative to the base year.
METRIC 16
Public Transportation
Track transit ridership trips within the county including bus routes, regional rail service, and AMTRAK.
METRIC result
This metric is based on data which, due the pandemic, have been delayed and will likely be released in summer 2021. As a result, only 2019 data is now available. It is anticipated the 2020 data will have an unprecedented impact on commuting volumes, due to the increase in remote office work during 2020.
METRIC 17
Improved Travel Time
Monitor the average travel time on selected major highways during peak hours on weekdays.
METRIC result
CCompared to the base year (2018), the average amount of time needed for a 15-mile trip on six of the major roadways during peak weekday hours in the county has been reduced by 0.4 minutes (or 24 seconds).

Travel time is measured each year along the following major roadways in Chester County: PA 100, US 1, US 30, US 422, US 202, and I-76 (the PA Turnpike).
METRIC 18
Coordinating Utilities with Growth Areas
Track development units connecting to public sewer and water services that will be located in designated growth areas.
METRIC result
During the current year (2020), 89.4% of all proposed lots or units reviewed were to be served by both public sewer and public water. This represents a modest increase from the base year (2018).
2019
METRIC 15
Active Transportation
Track the length of new multi-use trails, sidewalks, and bike lanes created in the county.
METRIC result
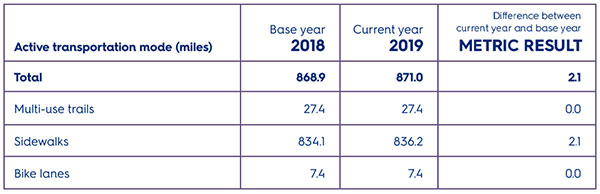
During the current year (2019), a total of 2.1 miles of new on-road bike lanes, sidewalks, and county and municipal multi-use trails (traveled by both pedestrians and bicyclists) were opened for public use. This represents an increase of 2.1 miles (or 0.3%) relative to the base year.

METRIC 16
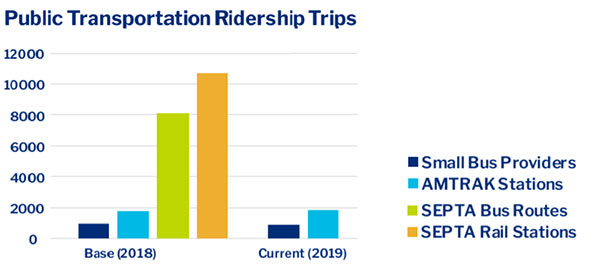
Public Transportation
Track transit ridership trips within the county including bus routes, regional rail service, and AMTRAK.
METRIC result
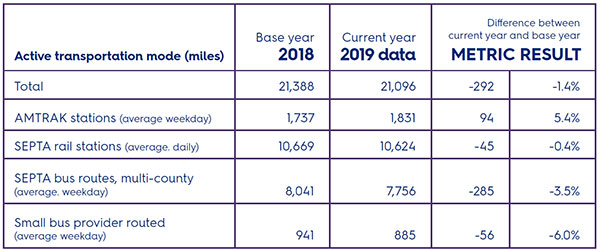
Due to COVID delays, the current year (2019) SEPTA bus and rail data will not be released until fall 2020. However, AMTRAK trips for 2019 increased by 94 (or 5.1%) relative to the base year. Small bus provider trips decreased by 86 (or 9.1%) relative to the base year.

METRIC 17
Improved Travel Time
Monitor the average travel time on selected major highways during peak hours on weekdays.
METRIC result
Compared to the base year (2018), the average amount of time needed for a 15-mile trip on six of the major roadways during peak weekday hours in the county has been reduced by 0.2 minutes (or 9.5 seconds).
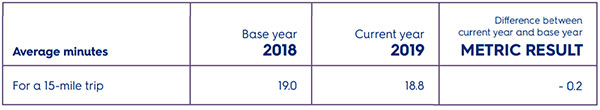
Travel time is measured each year along the following major roadways in Chester County: PA 100, US 1, US 30, US 422, US 202, and I-76 (the PA Turnpike).
METRIC 18
Coordinating Utilities with Growth Areas
Track development units connecting to public sewer and water services that will be located in designated growth areas.
METRIC result
During the current year (2019), 84.3% of all proposed lots or units reviewed were to be served by both public sewer and public water. This represents a modest increase from the base year (2018).